Imagine being able to see how forests grow, rivers shift, or the climate changes instantly and anywhere in the world. Earth Map, developed by FAO, makes this possible by turning complex satellite and climate data into clear maps and statistics that anyone can use.
Earth Map is a platform that opens a window into the planet’s living systems. Developed by FAO in collaboration with Google, it transforms vast amounts of satellite and climate data into maps and analyses that anyone can use. From forests and water to land degradation and biodiversity, information is organized thematically and made accessible through clear visual layers. What once required specialized tools and expertise is now available to countries, researchers, and farmers with just a few clicks.
With Earth Map, the story of change over time becomes visible. Users can trace decades of shifting rainfall patterns, rising temperatures, or expanding farmland, and instantly generate statistics that bring these dynamics into focus. Whether on a laptop in a research center or a mobile phone in the field, the platform delivers fast, intuitive insights that help people understand their environment and make informed decisions for the future.
Harnessing Cloud Power: Geospatial Analysis Made Easy for Everyone:
Earth Map provides access to global environmental data for informed decision-making. It is designed to overcome the technical difficulty often associated with accessing and processing large datasets by leveraging the power of Google Earth Engine (GEE).
Key Features
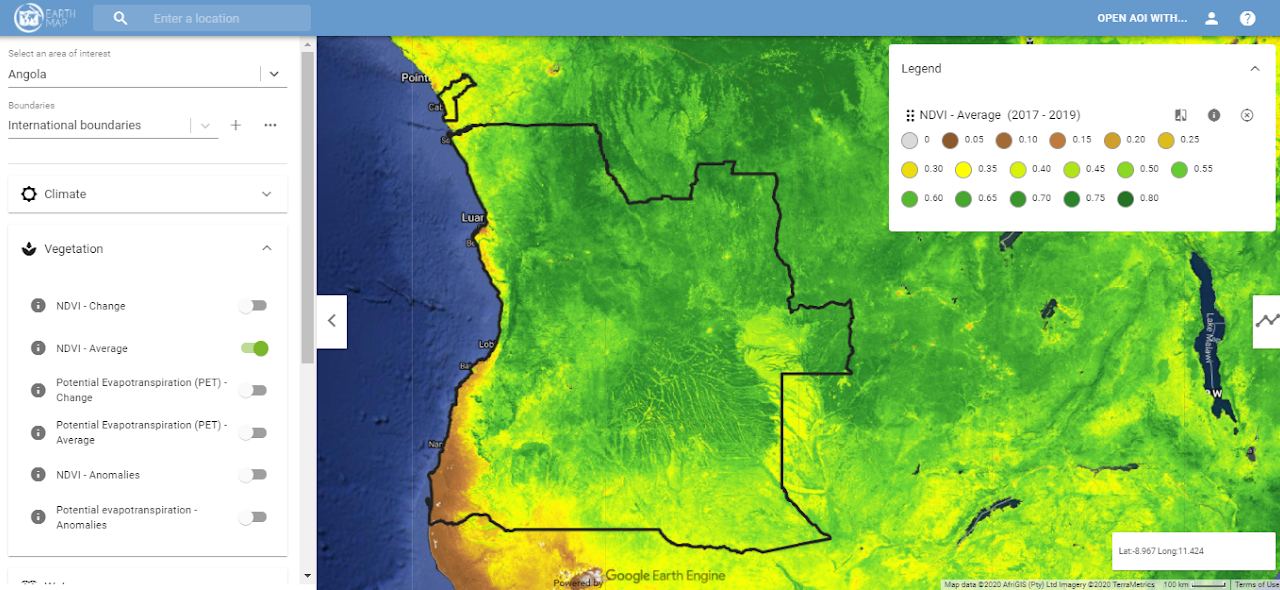
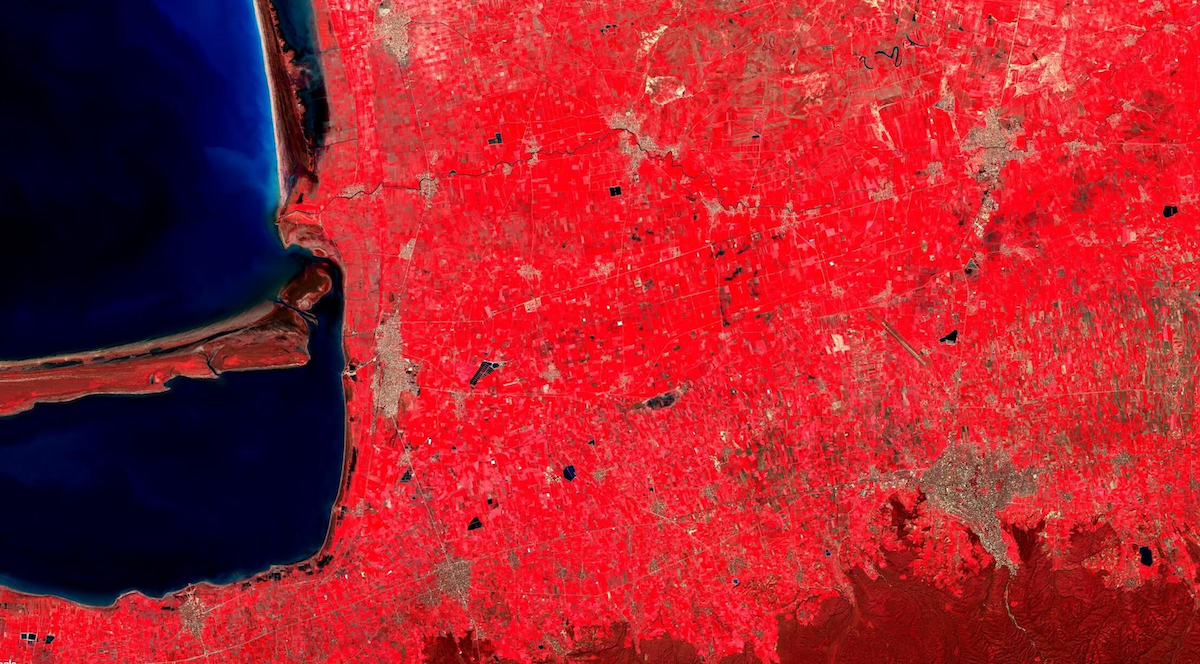
 Global Earth Data Access: Explore satellite imagery and datasets on forests, land, water, climate, and biodiversity in one platform.
- Time Series and Change Detection: Track environmental change over years or decades with clear temporal analyses of land cover, climate, and ecosystems.
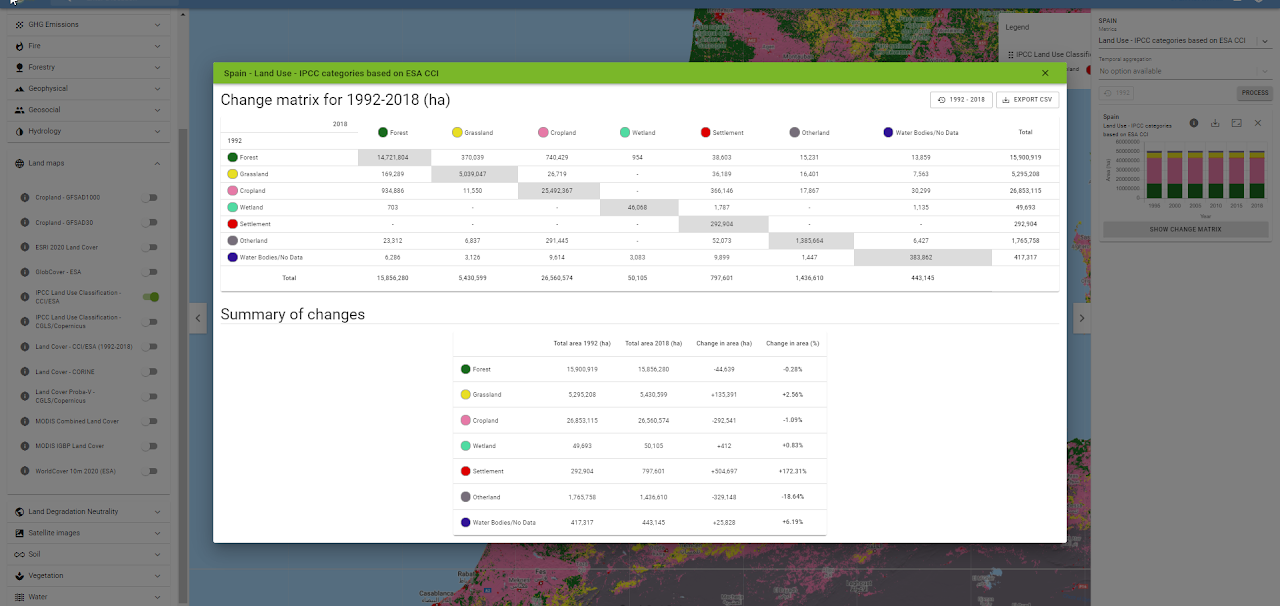
- Interactive Maps and Instant Statistics: Visualize data and generate on-the-fly statistics on temperature, precipitation, and land cover with just a few clicks.
- Decision-Making Support: Provide managers, researchers, and policymakers with evidence-based insights for sustainable land and resource management.
- Democratized and Cross-Device Access: Perform advanced analyses without GIS expertise or powerful computers, directly from any browser on any device.
- Open Sharing and Transparency:Disseminate maps and results easily, fostering collaboration, transparency, and informed decision-making.
- Frameworks and Reporting Alignment: Support REDD+, SDGs, and FAO programs with reliable data for monitoring, evaluation, and national reporting.
- Customizable Platform: Adapt Earth Map for specialized uses such as Whisp (EUDR compliance) or Strata (climate vulnerability assessments).
Designed For
Earth Map provides the data to design, monitor, and evaluate projects across global environmental priorities.
Sectors and use cases:
National Forest Monitoring and Reporting
Plan forest projects, detect deforestation, and generate reliable data for REDD+ and national reporting
Land Degradation Neutrality & Restoration
Assess baselines, monitor restoration actions, and evaluate progress toward Land Degradation Neutrality targets.
Climate Change Adaptation & Mitigation
Analyze vulnerabilities, monitor emissions drivers, and evaluate adaptation and mitigation interventions.
Biodiversity Conservation
Identify priority habitats, monitor threats to ecosystems, and assess the impact of conservation measures.
Agricultural Land & Water Management
Support land-use planning, monitor crop productivity, and evaluate sustainable farming and irrigation practices.
Workflow & Architecture
Features and Customisation Detailed Technical Phases
Earth Map is designed to be flexible and adaptable. It can be tailored into specialized portals for:
- Countries with national maps, for instance PNG and North Macedonia
-
Projects, e.g.
- WHISP (deforestation analysis for EUDR compliance)
- Strata (climate vulnerability hotspots)
- FERM (ecosystem restoration)
- PILA FOLUR (Integrated Landscape Management)
Customisation allows partners like national institutions to adjust the interface (language, logos, boundaries, layers) to their specific needs and to publish their own data while automatically benefiting from global feature updates. New analytical tools, such as Multi-Criteria Analysis (MCA), will further expand these capabilities by enabling users to combine datasets into suitability, vulnerability, or risk assessments.
Technology Stack
- Front End Web-based interface using modern web technologies (HTML, CSS, JavaScript) with React framework for rich user experience and dynamic map interactions.
- Back End Google Earth Engine serves as the main cloud platform, providing access to vast satellite data archives and computational power for processing geospatial analyses in real-time.
- Application Implements multi-thematic data management and visualization layers, enabling integration of diverse environmental datasets. On-the-fly spatial statistics and temporal trend analysis are core application features.
- GIS/Mapping Integration with Google Earth Engine and Google Maps for satellite imagery and base maps.
- Cloud & Hosting Hosted on Google Firebase cloud infrastructure, enabling scalability and seamless data access worldwide.
- Mobile Access Fully accessible through standard mobile web browsers, allowing on-the-go monitoring without dedicated apps.