What is Collect Earth Online?
If you need a scalable, collaborative, and transparent way to collect environmental data using high-resolution remotely sensed imagery - Collect Earth Online (CEO) is built for you. It was engineered to overcome the scalability and collaboration limits of desktop applications. By integrating survey design, data collection, monitoring, QA/QC, and publication into one platform, it removes technical friction and empowers teams at any scale.
CEO is engineered from the ground up as a web-based system for large-scale geospatial data collection. It eliminates the need for any desktop installation, making it accessible to any user with a supported web browser and an internet connection. CEO is explicitly designed to support collaborative projects involving dozens or even hundreds of interpreters, whether they are institutional staff, researchers, or citizen scientists.
Initially developed by SERVIR—a joint venture of the National Aeronautics and Space Agency (NASA) and the U.S. Agency for International Development (USAID)—CEO is now supported by a broad base of partners.
Key Features
Collect Earth Online (CEO) brings science to non-specialists by providing a free, open-source, intuitive platform for interpreting satellite imagery and answering environmentally critical questions regarding land cover, land use, forestry, and agriculture.

Collaborative model
Structured around Institutions, Projects, and Users; role management enables governance and large-scale teamwork.
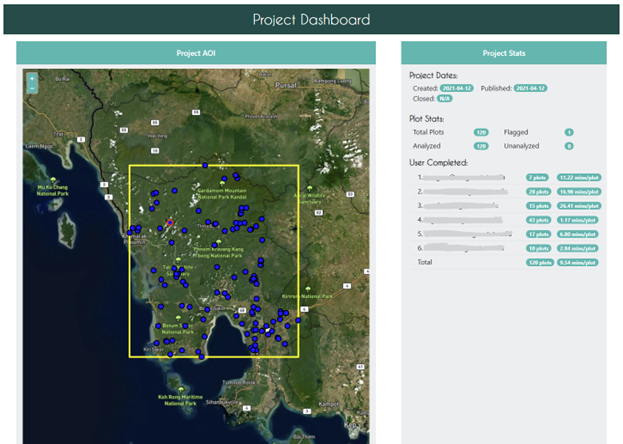
Built-in QA/QC & Management
Dashboards to compare user interpretations, identify inconsistencies, assign expert reviews, and avoid duplicate work via plot locking.
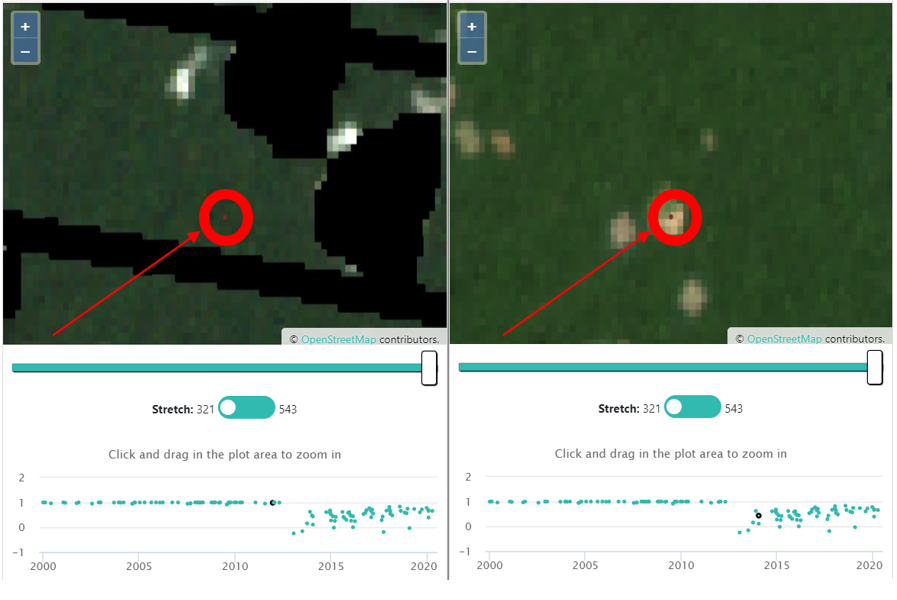
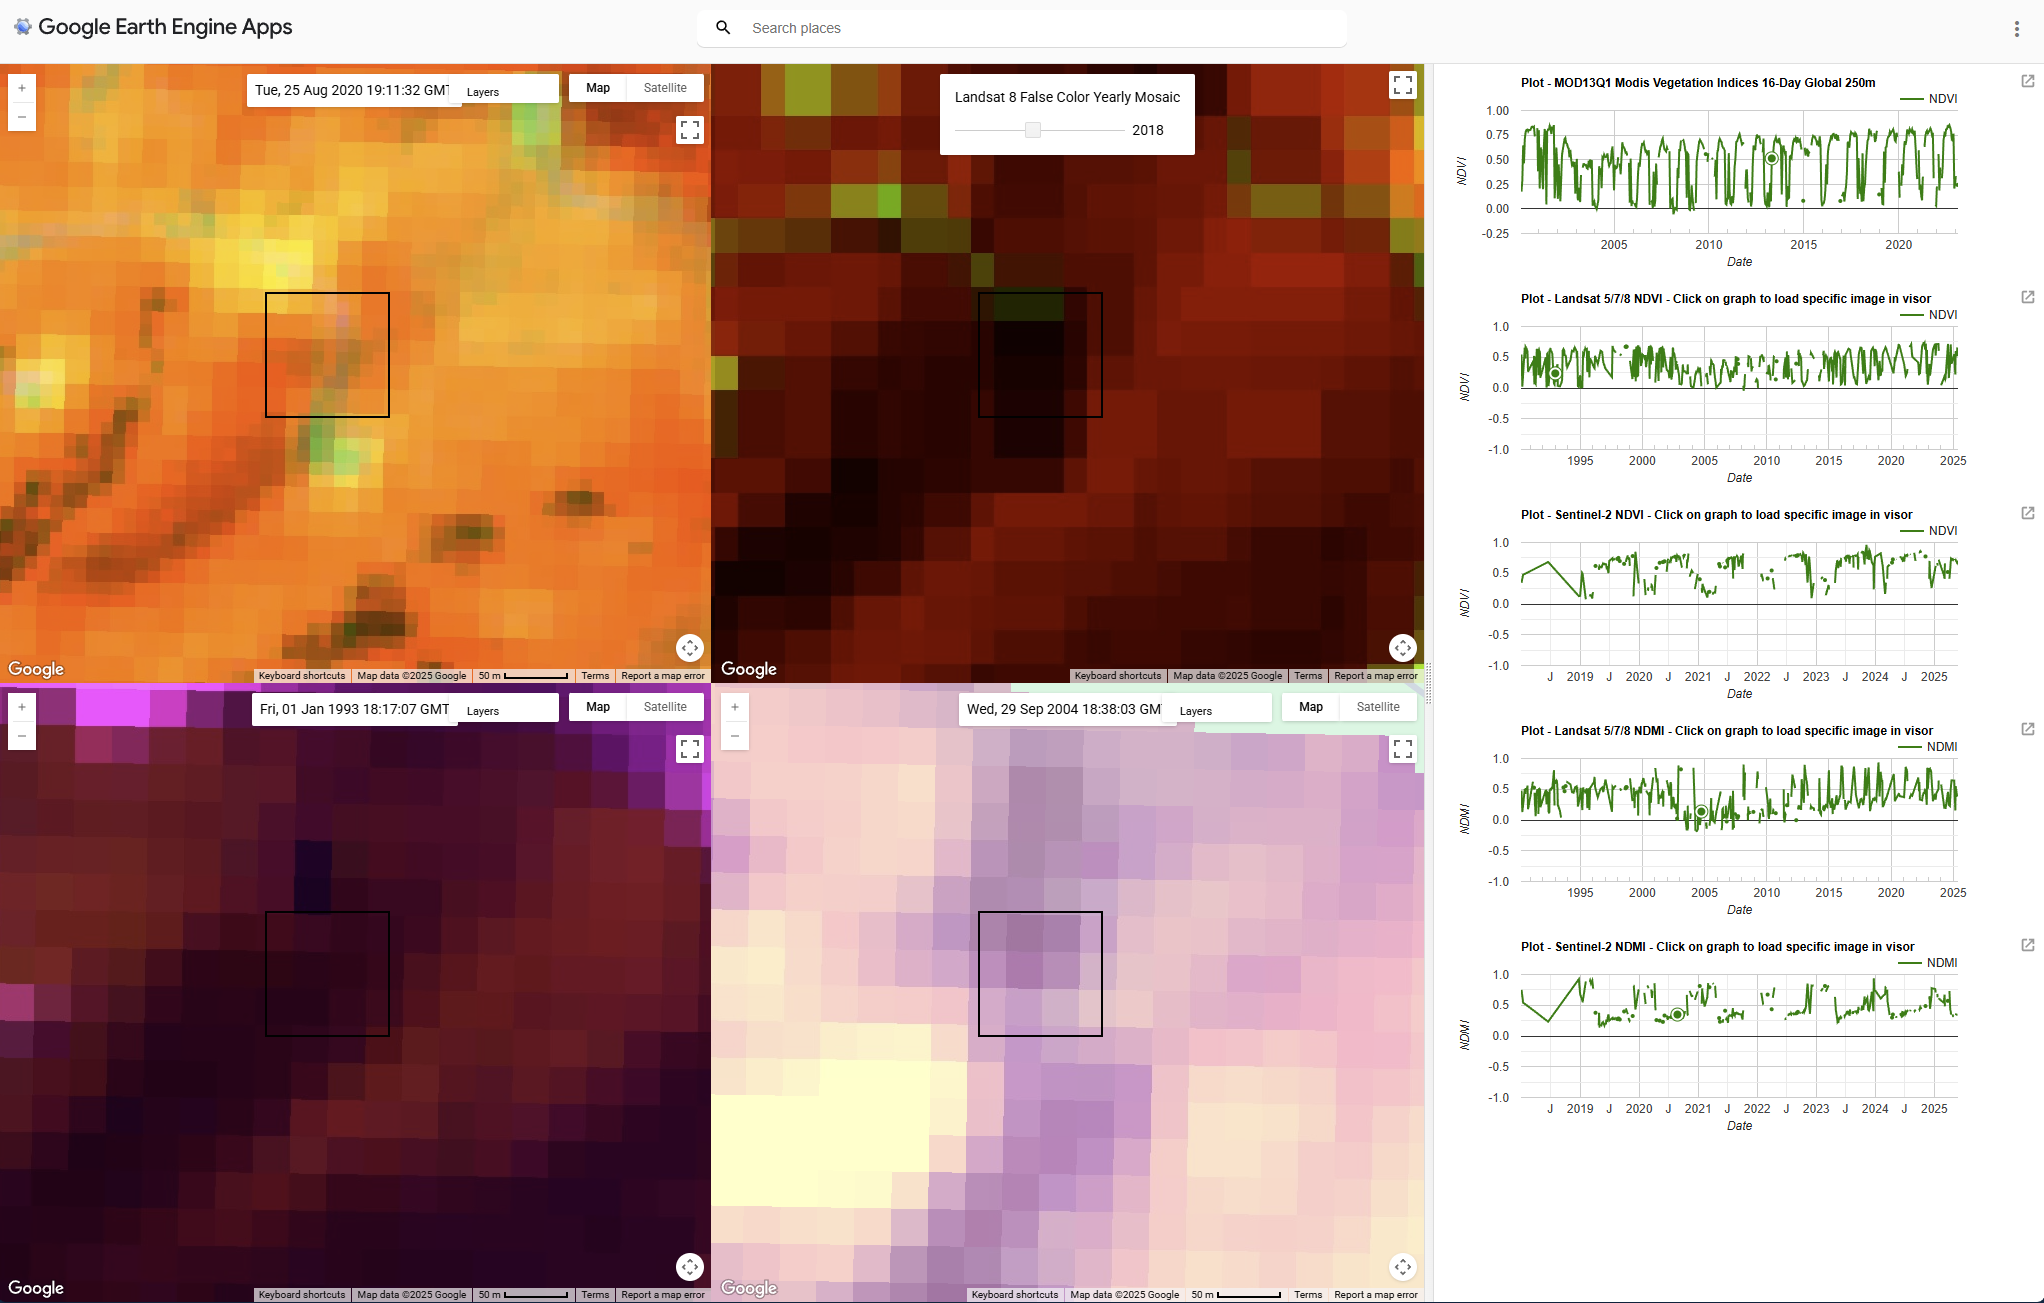
Geo-Dash + Degradation Widget
Time-series graphs of spectral indices (e.g. NDVI, NDFI) linked with imagery to help detect changes over time.
Data Permanence & Citability
Publish cleaned datasets with DOIs for reproducibility, accountability, and academic referencing.
Reference data for ML/AI
Collect robust, high-quality reference datasets to train, validate, and improve machine learning models for land cover classification, change detection, and other geospatial applications.
Open Export & Interoperability
Export to standard formats (CSV, shapefile) for further analysis or integration into GIS and statistical pipelines.
Flexible Privacy Settings
Control who can view your imagery and collect data for your projects through multiple privacy configurations.
Designed For
CEO has attracted a dedicated global community of users who rely on the platform to drive high-impact work monitoring deforestation and other types of land use change. Organizations around the world use CEO to detect deforestation, forest degradation, and other changes in the landscape. This data empowers users to implement policies to protect the landscape, mitigate climate change, and promote sustainable livelihoods.
CEO is designed to support a wide range of users conducting large scale sample-based land assessments for critical climate work. Examples include:
Governments and Institutions
Utilise date-stamped imagery to perform historical analyses or generate insights for monitoring forests, agriculture, and land use change. This informs policy development, reporting, and environmental stewardship, as well as detecting illegal activity contributing to forest loss or degradation.
Civil Society and NGOs
Lead community-driven monitoring initiatives at provincial and municipal levels. This work includes creating reforestation and conservation plans, while empowering groups at the local level and promoting transparency.
Citizen scientists
Contribute to crowdsourcing campaigns on forest degradation, deforestation, and land cover change. Collecting data in CEO does not require intensive training in remote sensing, so contributors come from a range of backgrounds and expertise levels.
REDD+ organizations
Account for carbon reduction performance through support for Monitoring, Reporting, and Verification (MRV). This data is used to implement REDD+ strategies and generate reports submitted to carbon project verifiers.
Academic &
Research Institutions
Entities responsible for land use monitoring, natural disaster assessment, and ecosystem services valuation can utilize Arena Mobile to gather data on land cover, land use changes, and environmental impacts, enhancing responsiveness and informed decision-making.
Academic &
Research Institutions
Create surveys to evaluate landscape level trends, generate statistical data, and perform analyses to evaluate land use, land cover, and change maps, as well as the creation of reproducible datasets for scientific studies and AI applications.

Workflow & Architecture
Workflow
Define the Area of Interest (AOI):
- The administrator defines the AOI for the project. This can be done by drawing a rectangle on a map, entering latitude and longitude coordinates, or uploading a shapefile. The AOI establishes the spatial boundaries for subsequent sampling and data collection.
- The wizard provides built-in options to generate plot and sample locations. Users can choose from simple random, systematic gridded, or stratified sampling designs.
- For stratified sampling, the administrator can upload a polygon shapefile where each feature represents a different stratum. CEO automatically handles the proportional allocation of samples and generates the plots via the platform’s backend.
- The administrator selects imagery to support data collection. This can include built-in satellite imagery provided by CEO or custom imagery connected by the user.
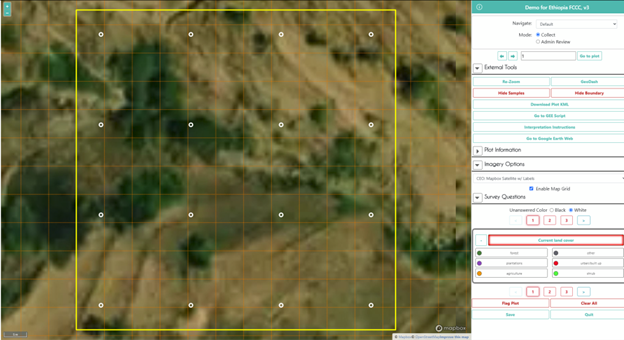
- CEO includes a fully integrated survey design module. The administrator creates questions, defines answer types, and sets up complex parent-child relationships and logical rules directly within the wizard. No separate application is needed.
Technology Stack
Backend Architecture: The server-side of CEO is a polyglot system composed of several interacting services.
- Primary Language/Framework: The core backend logic is predominantly written in Clojure, a dynamic, functional dialect of Lisp that runs on the JVM. This choice leverages the robustness and extensive libraries of the Java ecosystem while offering the expressive power of a Lisp-based language. Clojure and its underlying Java components (requiring JDK version 11 or 17) form the backbone of the application's business logic and API. Clojure accounts for a significant portion (16.2%) of the total codebase.
- GEE Integration: Communication with Google Earth Engine for running analyses and generating data for the Geo-Dash is handled by a Python 3 service. This service utilizes the official earthengine-api library to execute server-side requests to the GEE platform.
Frontend Architecture: The client-side is a modern Single-Page Application (SPA) that provides a dynamic and responsive user experience.
- Primary Language/Framework: The frontend is built entirely with JavaScript and associated technologies, which constitute the largest single part of the codebase at 67.9%.
- Build Tools: The JavaScript ecosystem is managed using Node.js (version 18 is required) and the npm package manager. The project uses Vite , a next-generation frontend tooling system, to handle the development server (npm run vite-dev) and optimize the application for production builds.
Database: The persistence layer is built on a powerful, enterprise-grade open-source database stack.
- Core Database: The system uses PostgreSQL (version 12 or higher is required) as its object-relational database. This provides a robust, transactional, and scalable foundation for storing all project data, user information, and survey definitions.
- Spatial Extension: The PostGIS extension (version 3.2+ required) is a critical component, transforming the PostgreSQL database into a full-featured spatial database. It enables the efficient storage, indexing, and querying of geographic data types such as points (samples) and polygons (AOIs).
- Database Language and Extensions: The database schema makes extensive use of custom functions and procedures written in PL/pgSQL (the procedural language for PostgreSQL), which accounts for 8.3% of the codebase. It also utilizes the pgcrypto extension to handle cryptographic operations within the database itself.
- Configuration: The entire system is highly configurable. Key parameters such as database connection strings, external API keys, and mail server settings are managed in a central config.edn file.11 Project dependencies are explicitly defined in deps.edn for the Clojure backend and package.json for the Node.js frontend.
- Deployment: The application is designed to be deployed as a persistent web service on a server, with support for standard Linux service managers like systemd and sysvinit.